
As we arrive at the mid-year the economy has managed to maintain resilience amid volatility. Inflation eased and there was healthy payroll growth but a caution of private hiring softness and the pending rollout of tariffs signal emerging risk. The Fed has maintained a steady hand by not making any changes to the interest rate target even through criticism to do so. The 10-Year Treasury backed off its high on June 4th of 4.5% to end the month at 4.25%. This had a favorable affect on mortgage rates as we also saw a gradual decrease through the month of June.
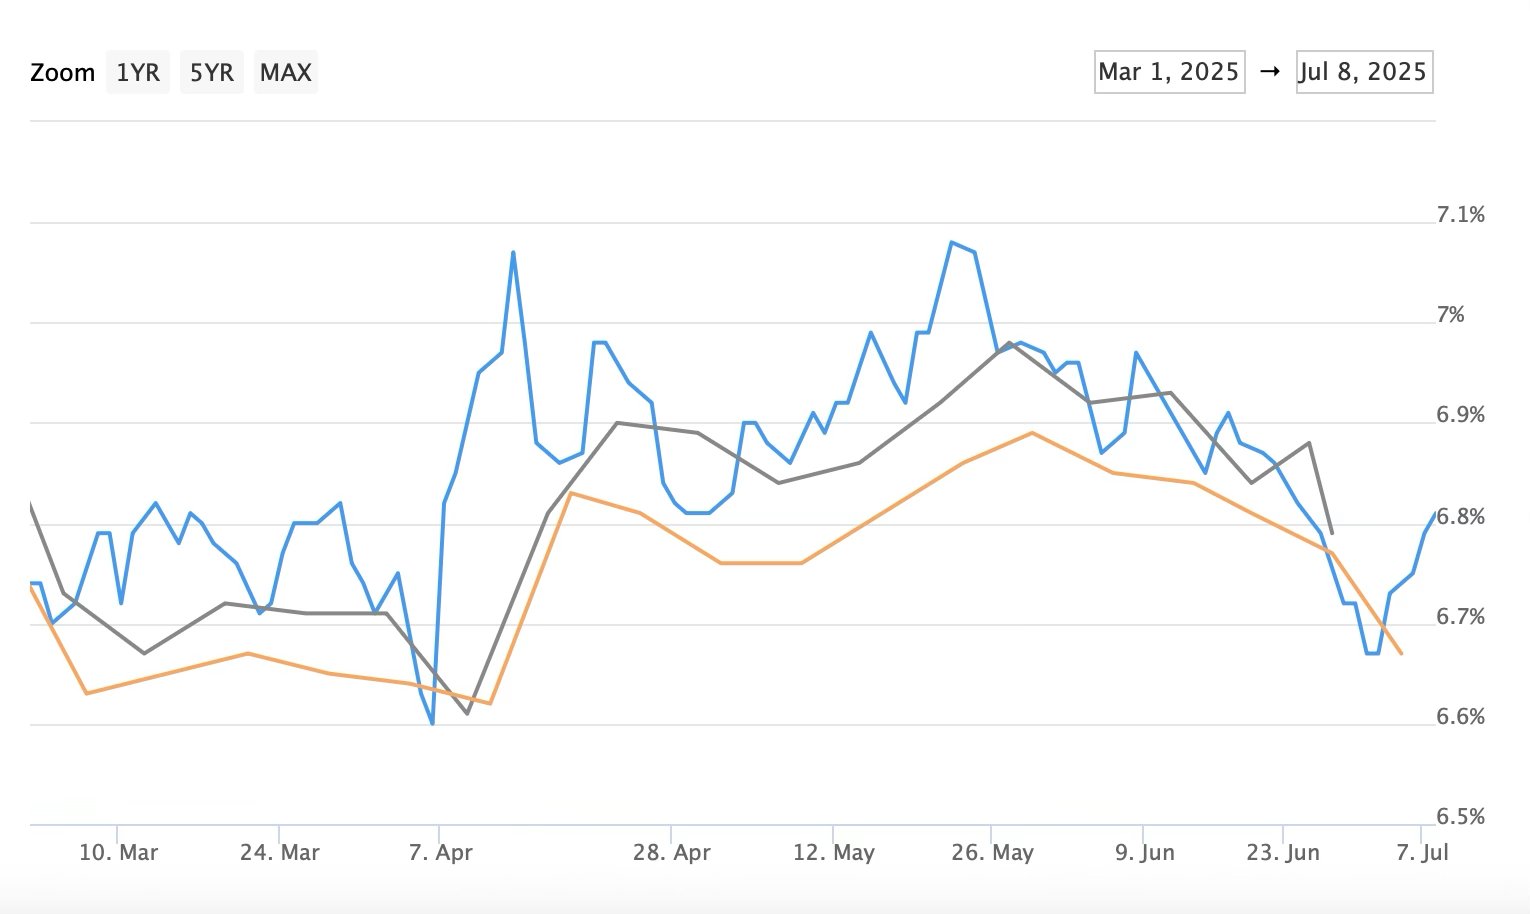
30-Year Conventional
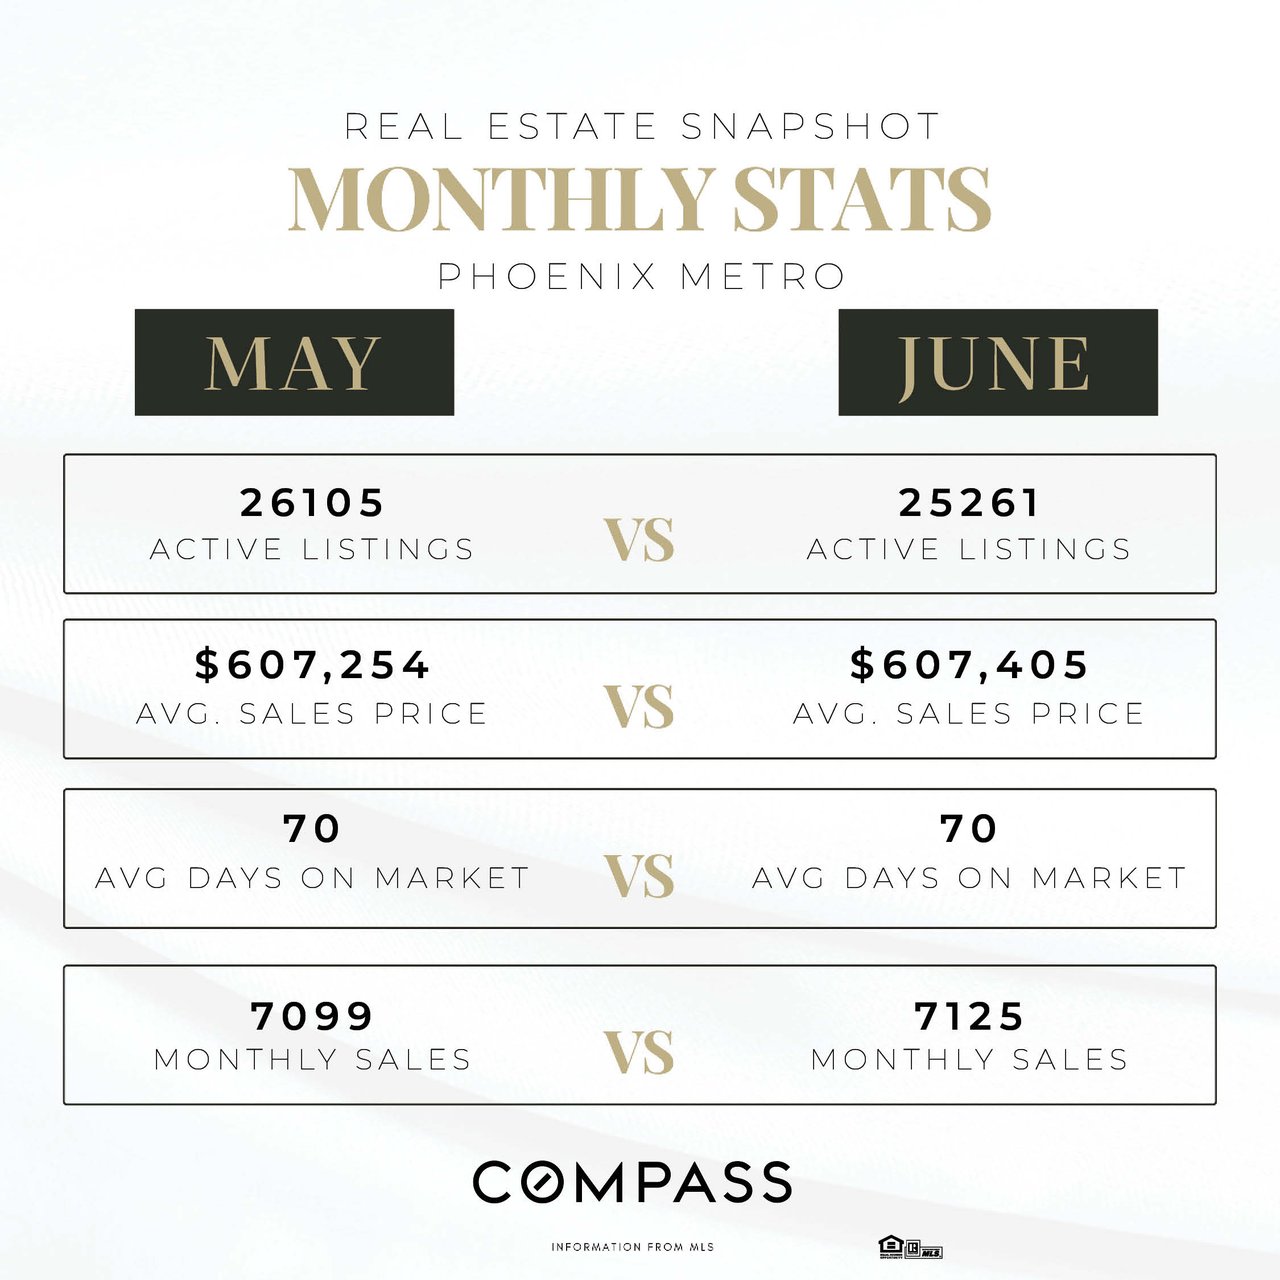
Taking a closer look at the metro Phoenix real estate market over the past year, a noticeable trend with median sales prices have revealed a clear stratification across different housing markets in the Valley. By comparing monthly median sales prices with figures from 12 months ago, a consistent trend is emerging that luxury markets are holding their ground or even appreciating, while more affordable sectors are under pressure.
Luxury-heavy cities are leading in price performance. For example, single-family detached homes in Scottsdale have seen a 4.3% price increase over the past year. This upward movement reflects sustained demand and relative stability at the top of the market. On the other hand, mid-tier cities like Chandler are seeing flat or nearly flat performance. Chandler itself is down just 0.1% year-over-year, indicating stagnation but not yet a downturn. These areas seem to be on the edge, with pricing direction heavily influenced by shifts in interest rates or buyer sentiment.
In contrast, cities with a large share of entry-level housing are bearing the brunt of price corrections. Avondale, a city largely defined by its affordability, has experienced a 5.3% drop in median prices for single-family homes over the same time period. This decline illustrates how sensitive the lower end of the market is to economic forces such as higher interest rates and affordability constraints. It also suggests that many buyers in this tier have either been priced out or are waiting on the sidelines.
While exceptions exist in every category, the overarching trend is clear: the luxury market continues to perform more robustly, while the entry-level market is facing the most pressure. For buyers and sellers alike, understanding which segment your property falls into is now more crucial than ever.
Want to break this down further? Have other market-related questions? Reach out to us and we can discuss.
|
ARMLS APPRECIATION BY PRICE RANGE |
|
Price Range |
2024 June $/SF |
2025 June $/SF |
% Difference |
|
Under $300K |
$193.23 |
$187.17 |
-3.1% |
|
$300K-400K |
$236.51 |
$228.23 |
-3.5% |
|
$400K-500K |
$245.29 |
$240.48 |
-2.0% |
|
$500K-600K |
$261.67 |
$255.91 |
-2.2% |
|
$600K-800K |
$282.25 |
$282.24 |
0 |
|
$800K-1M |
$309.09 |
$314.98 |
1.9 |
|
$1M-1.5M |
$373.32 |
$375.69 |
0.6% |
|
$1.5M-2M |
$427.56 |
$465.68 |
8.9% |
|
$2M-3M |
$537.00 |
$587.25 |
9.4% |
|
Over $3M |
$776.35 |
$790.63 |
1.8% |
|
$296.21 |
$295.37 |
-0.3% |